Energy is the lifeblood of all living organisms on Earth, and it traces its origin back to the sun, where it begins as light energy. The intricate processes that unfold in the natural world allow this energy to be harnessed and utilized for various life processes. In this article, we’ll delve into the journey of energy, from its conversion in plants to its utilization in the human body.
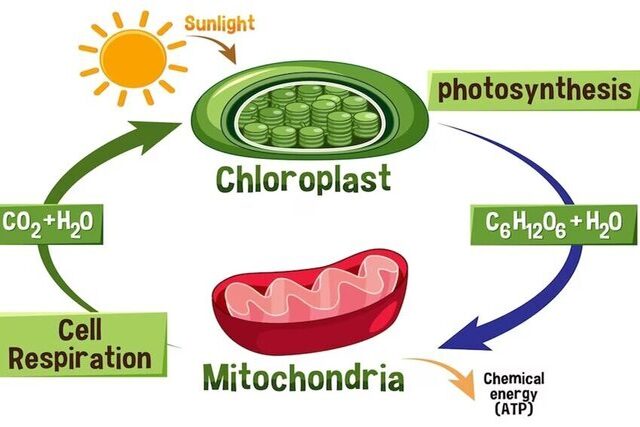
Photosynthesis – Nature’s Power Plant: Photosynthesis is the remarkable process by which plants capture light energy from the sun and transform it into stored chemical energy. Using chlorophyll and other pigments, plants convert carbon dioxide and water into glucose and oxygen. This glucose serves as a primary energy source for the plant, while oxygen is released into the atmosphere as a byproduct. Through this vital process, plants play a pivotal role in transforming and storing solar energy, ultimately supporting life on Earth.
Energy Transfer to Humans: For humans and other animals, the energy journey begins when we consume plants or ingest animals that have themselves consumed plants. These organisms serve as intermediaries, transferring the stored chemical energy from plants to higher trophic levels in the food chain.
Nutrients and Energy Substrates: The nutrients in the foods we consume are primarily provided in the form of carbohydrates, fats, and proteins. These are the three fundamental energy substrates that fuel our metabolic processes. These energy-rich molecules are the currency of life, serving as the backbone of bioenergetics – the science of how living organisms acquire and utilize energy.
The Marvel of Bioenergetics: Within the cells of all living organisms, there exists a sophisticated network of chemical pathways that meticulously convert these energy substrates into a usable form of energy called adenosine triphosphate (ATP). ATP is akin to a rechargeable battery, storing and providing energy for various cellular functions. The interconnected web of chemical reactions that govern these processes is collectively known as metabolism.
Calories – The Measure of Energy: Since all forms of energy eventually dissipate as heat, scientists have developed a unit of measurement to quantify the energy content of biological systems – the calorie (cal). Specifically, 1 calorie represents the amount of heat energy required to raise 1 gram of water by 1 degree Celsius, within the range of 14.5°C to 15.5°C. In human nutrition, energy is expressed in kilocalories (kcal), where 1 kcal equals 1,000 cal. It’s worth noting that while the term “Calorie” (with a capital C) is sometimes used interchangeably with kilocalorie, the latter is the more precise scientific unit of measurement.
Energy Utilization in the Body: Energy within the human body serves various critical functions. A portion of it is allocated for growth and repair processes, which are essential for building muscle mass during training and healing muscle damage post-exercise or injury. Furthermore, energy is required for active transport processes, facilitating the movement of vital substances like sodium, potassium, and calcium ions across cell membranes. This active transport mechanism is fundamental for cell survival and maintaining internal equilibrium (homeostasis).
Muscle Action and Force Generation: Energy isn’t just about maintaining basic bodily functions; it’s also vital for our physical activities. Myofibrils, the contractile units within muscle cells, harness energy to enable the sliding of actin and myosin filaments. This process results in muscle actions and the generation of force, which is integral to our ability to move and perform various physical tasks.
The Role of Carbohydrates: Carbohydrates play a significant role in energy metabolism, and their utilization during exercise is influenced by both their availability and the efficiency of the muscle’s carbohydrate metabolism system. All carbohydrates are eventually converted into glucose, a simple six-carbon sugar. Glucose is transported through the bloodstream to all body tissues. Under resting conditions, ingested carbohydrates are stored as glycogen in muscles and the liver. Muscle glycogen serves as a readily available source of glucose for energy production within the muscle cells themselves. Liver glycogen, on the other hand, can be converted back into glucose as needed and transported via the bloodstream to active tissues where it is metabolized.
Carbohydrate Replenishment: It’s essential to continually replenish our carbohydrate reserves, as the glycogen stores in both the liver and muscles are limited. Prolonged and intense exercise, especially in cases of inadequate carbohydrate intake, can deplete these stores. In such scenarios, we rely heavily on dietary sources of starches and sugars to ensure our muscles have a consistent supply of carbohydrates for energy production. Notably, carbohydrates are the primary energy source for brain tissue, emphasizing their critical role in cognitive function. Severe carbohydrate depletion can result in negative cognitive effects.
Diverse Sources of Energy
In the quest to understand energy utilization in the human body, it’s imperative to explore the multifaceted role that fats, proteins, and carbohydrates play.
Fat – The Endurance Fuel: Fats stand out as the heavyweight champions of energy storage in the human body. They provide a substantial portion of the energy required during prolonged and less intense exercises. Remarkably, the potential energy stored in fats far surpasses that of carbohydrates, both in terms of weight and energy content. Consider a lean individual with approximately 12% body fat. For such a person, the body’s fat stores represent a vast reservoir of potential energy. In comparison, the body’s carbohydrate stores are relatively limited. However, it’s essential to note that fat is not as readily available for cellular metabolism as carbohydrates. It must undergo a transformation from its complex form, triglyceride, into its fundamental components, glycerol, and free fatty acids (FFAs), before it can be used to generate ATP – the cell’s energy currency.
High Energy Yield of Fats: The energy yield from fats is considerably higher than that of carbohydrates. While a gram of carbohydrate yields about 4.1 kilocalories (kcal) per gram, a gram of fat packs an impressive 9.4 kcal. This substantial energy content makes fats an invaluable source of endurance fuel. However, it’s essential to acknowledge that the rate of energy release from fats is relatively slow, making them less suitable for meeting the high-energy demands of intense muscular activities.
Diverse Roles of Other Fats: Apart from serving as an energy source, various types of fats perform essential non-energy-producing functions in the body. Phospholipids, for instance, are critical structural components of all cell membranes, forming protective sheaths around certain large nerves. Steroids, found in cell membranes, also serve as hormones or as the building blocks for hormones like estrogen and testosterone. These functions underscore the importance of fats beyond their energy-yielding capacity.
Protein – A Secondary Energy Source: Proteins, primarily known for their role as building blocks in the body, can also serve as a minor energy source under specific circumstances. When needed, proteins can be converted into glucose through a process called gluconeogenesis. In instances of severe energy depletion or starvation, proteins may even be used to generate free fatty acids (FFAs) for cellular energy, a process known as lipogenesis. However, protein’s primary role remains structural and enzymatic. A gram of protein yields about 4.1 kcal, contributing up to 5% to 10% of the energy required for prolonged exercise.
Controlled Energy Release: For energy to be useful, it must be released from chemical compounds at a controlled rate. Two key factors dictate this rate: substrate availability and enzyme activity. Substrate availability refers to the abundance of a primary fuel source. When one type of fuel, such as carbohydrates, is plentiful, cells tend to rely more heavily on it for energy production, underlining the mass action effect. On the other hand, enzymes, specialized protein molecules, play a pivotal role in controlling the rate of free energy release. Enzymes accelerate the breakdown (catabolism) of chemical compounds. For a chemical reaction to occur, reacting molecules must have sufficient initial energy to initiate the reaction. Enzymes do not induce reactions or determine the amount of energy produced but facilitate reactions by reducing the activation energy required to initiate them.
Rate-Limiting Enzymes: In the intricate web of metabolic pathways within the body, one enzyme typically stands out as the key regulator of the rate of energy release. This enzyme, often found at an early stage in the pathway, is known as the rate-limiting enzyme. Its activity is influenced by the accumulation of substances further along the pathway, which exert negative feedback to decrease enzyme activity. Factors that can impact enzyme activity include changes in temperature, pH, and the availability of cofactors. Enzymes often require these cofactors to function effectively, further influencing the rate of metabolic reactions. Negative feedback mechanisms typically involve the end product of the pathway or ATP and its breakdown products (ADP and inorganic phosphate). These substances can accumulate and signal to slow down further production or release of energy, maintaining a delicate balance in energy utilization.
Understanding these intricacies of energy utilization within the human body sheds light on the remarkable precision with which our systems regulate and allocate energy, ensuring that we have the necessary resources to fuel both daily life and physical activities.
Unlocking the Power of Adenosine Triphosphate (ATP)
The Molecular Fuel of Life: In the intricate landscape of cellular energy metabolism, adenosine triphosphate, or ATP, stands as the central and immediate source of energy for nearly all biological processes, including the critical function of muscle contraction. ATP is a complex molecule composed of three fundamental components: adenosine (a molecule formed by the fusion of adenine and ribose), and three inorganic phosphate (Pi) groups. This unique molecular structure makes ATP a powerhouse for energy storage and transfer.
Energy Unleashed: The potent energy residing within ATP is unleashed when it undergoes hydrolysis, a process initiated by the enzyme ATPase. During this reaction, the last phosphate group in ATP breaks away, resulting in the rapid release of a substantial amount of free energy. Under standard conditions, this reaction yields approximately 7.3 kilocalories (kcal) per mole of ATP. However, within the cellular environment, this energy release can be even greater, potentially reaching up to 10 kcal per mole of ATP or more. As a consequence, ATP is converted into adenosine diphosphate (ADP) and a single phosphate molecule (Pi).
ATP Synthesis and Breakdown: The cycle of ATP synthesis and breakdown is the cellular equivalent of a never-ending relay. To generate ATP, a phosphate group is added to adenosine diphosphate (ADP) through phosphorylation. This transformation demands a substantial amount of energy, reflecting the high-energy phosphate bonds characteristic of ATP. Cells engage in the continuous generation of ATP through a multitude of metabolic pathways. Some ATP is generated independently of oxygen availability, a process known as substrate-level phosphorylation. Additionally, ATP production can occur without oxygen, or with its assistance, in a process termed oxidative phosphorylation. This metabolic symphony ensures that ATP remains readily available for various cellular functions.
Primary Pathways of Energy Generation: To meet the ceaseless demand for energy, cells harness the power of three primary metabolic pathways:
- ATP-PCr System: The ATP-PCr system, which comprises the simplest and most immediate energy source, involves the utilization of phosphocreatine (PCr). PCr stores energy by donating a phosphate group to ADP, forming ATP. Creatine kinase, an enzyme, catalyzes this process. While energy released from PCr is not directly used for cellular work, it efficiently regenerates ATP to maintain a consistent supply under resting conditions.
- Glycolytic System (Glycolysis): Operating independently of oxygen, the glycolytic system, or glycolysis, serves as the second energy pathway. It transforms glucose or glycogen into ATP and pyruvate through a series of chemical reactions. This system excels in providing rapid but short-lived bursts of energy.
- Oxidative System (Oxidative Phosphorylation): The oxidative system, also known as oxidative phosphorylation, is the most enduring and efficient energy provider. It relies on the presence of oxygen to convert carbohydrates, fats, and proteins into ATP through a highly intricate series of reactions in the mitochondria. This pathway’s remarkable capacity for sustained energy production makes it ideal for endurance activities.
Precise Regulation through Feedback Mechanisms: The control of energy production is orchestrated with precision within the body. Negative feedback mechanisms involving rate-limiting enzymes play a pivotal role. These enzymes act as gatekeepers, moderating the rate of metabolic reactions. Substances that accumulate further along the metabolic pathway can influence the rate-limiting enzyme, either enhancing or inhibiting its activity. The aim is to maintain a balanced and regulated energy supply that meets the dynamic requirements of the body’s various functions.
ATP-PCr System:
The Simplest Energy Pathway: The ATP-PCr system represents the most straightforward and immediate energy source available to cells. In addition to storing a small amount of ATP directly, cells house another high-energy phosphate molecule, phosphocreatine (PCr), or creatine phosphate. The process involves the donation of a phosphate group from PCr to ADP to form ATP. While the energy released from PCr is not directly utilized for cellular work, it efficiently regenerates ATP, ensuring a constant supply under resting conditions.
Creatine Kinase: The Catalyst of Energy Transfer: Creatine kinase, an enzyme found in muscle cells, catalyzes the release of energy from PCr by separating phosphate (Pi) from creatine. The released energy is then used to add a phosphate molecule to adenosine diphosphate (ADP), forming ATP. The enzyme’s activity is highly responsive to changes in ADP and Pi concentrations. When exercise initiates, the depletion of ATP leads to increased ADP levels, consequently enhancing creatine kinase activity and promoting the breakdown of PCr to generate additional ATP.
Limitations of the ATP-PCr System: Although the ATP-PCr system is the quickest means of energy production, it has inherent limitations. The combination of ATP and PCr stores can support muscle energy needs for only a brief period, ranging from 3 to 15 seconds during high-intensity activities such as sprinting. Beyond this initial burst of energy, muscles must rely on alternative energy systems, such as glycolysis and oxidative phosphorylation, to maintain energy production during prolonged efforts. The ATP-PCr system is classified as substrate-level metabolism, and while it can function in the presence of oxygen, it does not require oxygen for its energy production process.
The Onset of Exhaustion: As intense exercise unfolds, ATP remains relatively stable while PCr levels steadily diminish as they contribute to ATP replenishment. However, as exercise intensifies and extends beyond a few seconds, both ATP and PCr reserves are exhausted, rendering the muscles unable to support further contraction and relaxation. At this juncture, alternative energy pathways, particularly glycolysis and oxidative phosphorylation, assume the mantle of energy providers to sustain muscle function.
The Glycolytic System:
Unraveling Glycolysis: When the immediate energy surge of the ATP-PCr system wanes, a more intricate method of ATP production takes center stage, known as the glycolytic system. This system hinges on glycolysis, a complex pathway that orchestrates the breakdown of glucose through a series of enzymatic reactions. The cascade of steps within glycolysis ensures a gradual release of energy while producing vital ATP molecules. Let’s explore the mechanics of this metabolic journey.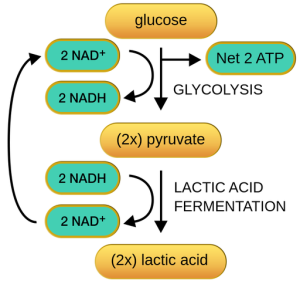
Fueling with Glucose: Glucose is the primary source of sugar coursing through the bloodstream, accounting for approximately 99% of blood sugar content. This glucose is derived from dietary carbohydrates and the liver’s glycogen reserves. Glycogen, synthesized from glucose through a process called glycogenesis, serves as an energy reservoir stored in the liver and muscles until required. When needed, glycogen undergoes glycogenolysis, converting it into glucose-1-phosphate, which subsequently enters the glycolysis pathway.
Initiating Glycolysis: Before glucose or glycogen can yield energy, they must first be converted into glucose-6-phosphate. Intriguingly, this initial step necessitates the expenditure of one ATP molecule per glucose molecule. However, when glycogen is the substrate, glucose-6-phosphate can be formed directly from glucose-1-phosphate without the need for this energy input. Glycolysis officially commences once glucose-6-phosphate is generated.
The Complex Path of Glycolysis: Glycolysis comprises a series of 10 to 12 enzymatic reactions that break down glycogen into pyruvic acid, which is subsequently transformed into lactic acid. All these biochemical transformations take place within the cytoplasm of the cell. The net gain from glycolysis is the formation of 3 moles (mol) of ATP for every mole of glycogen that is degraded. When glucose serves as the substrate instead of glycogen, the net ATP gain is reduced to 2 mol because one ATP molecule is invested in converting glucose to glucose-6-phosphate.
Limited ATP Output: The glycolytic system does not yield copious amounts of ATP compared to other energy pathways. Despite this limitation, the collaborative efforts of the ATP-PCr and glycolytic systems allow muscles to generate force even when the oxygen supply is constrained. These two systems predominantly fuel the early stages of high-intensity exercise.
Lactic Acid Accumulation: A significant drawback of anaerobic glycolysis is the accumulation of lactic acid in muscles and bodily fluids. During glycolysis, pyruvic acid is generated. In the absence of oxygen, pyruvic acid is directly converted into lactic acid (C3H6O3). While lactic acid is produced by anaerobic glycolysis, it swiftly dissociates, giving rise to lactate.
Effects of Lactic Acid Buildup: In high-intensity activities lasting 1 to 2 minutes, the glycolytic system is under substantial demand, leading to an increase in muscle lactic acid concentrations. These concentrations can surge from a resting value of approximately 1 mmol/kg of muscle to over 25 mmol/kg. The accumulation of lactic acid hinders further glycogen breakdown as it impairs the function of glycolytic enzymes. Additionally, lactic acid diminishes the fibers’ capacity to bind calcium, potentially impairing muscle contraction.
Rate-Limiting Enzyme – Phosphofructokinase (PFK): In glycolysis, the rate-limiting enzyme that governs the pace of the entire pathway is phosphofructokinase (PFK). Like most rate-limiting enzymes, PFK catalyzes an early step in the pathway, specifically the conversion of fructose-6-phosphate into fructose-1,6-biphosphate. PFK activity is influenced by the concentration of ADP and Pi. Elevated levels of these substances enhance PFK activity, thus accelerating glycolysis. Conversely, high concentrations of ATP inhibit PFK, slowing glycolysis. Additionally, feedback mechanisms involve products of the Krebs cycle, such as citrate and hydrogen ions, which also act as inhibitors of PFK.
The Transition to Oxidative Metabolism: Although the ATP-PCr and glycolytic systems efficiently supply energy, their capabilities are limited. They are incapable of meeting the energy requirements for prolonged all-out activities lasting more than 2 minutes. As the duration of exercise extends, the third energy system, the oxidative system, takes center stage to provide the sustained energy needed to power muscle function during extended efforts.
The Oxidative System:
Introduction to the Oxidative System: The culmination of cellular energy production is realized in the oxidative system, the most intricate of the three primary energy systems. This system revolves around the process of cellular respiration, which, in contrast to anaerobic processes, heavily relies on oxygen for energy generation. Cellular respiration is an aerobic process, and its epicenter is the mitochondria, specialized cell organelles found within muscle fibers and distributed throughout the cell’s sarcoplasm.
Continuous Energy Supply for Muscles: Muscles engaged in prolonged activity necessitate a steady supply of energy to sustain force production. Unlike the rapid initiation of anaerobic energy systems, the oxidative system takes a more gradual approach but boasts a significantly larger capacity for energy production. Hence, aerobic metabolism is the primary means of energy generation during endurance activities, requiring robust support from the cardiovascular and respiratory systems to transport oxygen to active muscles. The oxidative system can extract energy from both carbohydrates and fats.
Oxidation of Carbohydrates:
The process of generating ATP through the oxidative breakdown of carbohydrates involves three distinct phases:
- Glycolysis : Glycolysis plays a pivotal role in carbohydrate metabolism, serving as a common pathway for both anaerobic and aerobic ATP production. Regardless of the presence of oxygen, glycolysis proceeds in the same manner. The ultimate fate of its end product, pyruvic acid, depends solely on the availability of oxygen. When oxygen is scarce, pyruvic acid gives rise to lactic acid, whereas, in the presence of oxygen, it is transformed into acetyl coenzyme A (acetyl CoA).
- The Krebs Cycle : Following the conversion of pyruvic acid into acetyl CoA, the next phase unfolds within the Krebs cycle (also known as the citric acid cycle or tricarboxylic acid cycle). This intricate series of chemical reactions allows for the complete oxidation of acetyl CoA, resulting in the formation of high-energy compounds such as guanosine triphosphate (GTP). GTP transfers a phosphate (Pi) group to adenosine diphosphate (ADP) to produce ATP. Two ATP molecules are directly formed by substrate-level phosphorylation within the Krebs cycle, in addition to the conversion of the original carbohydrate into carbon dioxide and hydrogen. Like other pathways in energy metabolism, the Krebs cycle is under the influence of negative feedback mechanisms and rate-limiting enzymes.
- Electron Transport Chain : Throughout the metabolic processes, hydrogen ions (H+) are released. These ions, generated during glycolysis, the conversion of pyruvic acid to acetyl CoA, and various steps within the Krebs cycle, form bonds with coenzymes like nicotinamide adenine dinucleotide (NAD) and flavin adenine dinucleotide (FAD), converting them into their reduced forms (NADH and FADH2, respectively). These reduced coenzymes transport the hydrogen atoms, or electrons, to the electron transport chain, a complex system of mitochondrial proteins. High-energy electrons are transferred through this chain from one complex to another, driving the pumping of H+ ions from the mitochondrial matrix into the outer mitochondrial compartment. As these H+ ions flow back across the membrane, ATP synthesis is activated, culminating in ATP production through the enzyme ATP synthase. This entire process is known as oxidative phosphorylation.
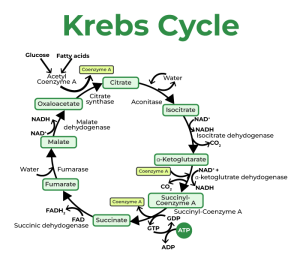
For every pair of electrons transported by NADH to the electron transport chain, three ATP molecules are generated, while FADH2 yields only two ATP molecules. However, due to the energy expended in shuttling H+ ions across the mitochondrial membrane, the net energy yield is approximately 2.5 ATPs per NADH and 1.5 ATPs per FADH2. Consequently, the overall ATP production per molecule of glucose is around 32, with muscle glycogen yielding 33 ATPs. It’s worth noting that some textbooks may still cite a net energy production of 36-39 ATPs per glucose molecule, not accounting for the energy expenditure required in shuttling electrons across mitochondrial membranes.
Fat Metabolism:
Introduction to Fat as an Energy Source: Fat serves as a substantial contributor to the body’s energy requirements, providing a critical source of fuel for various physiological processes, including muscle function. While muscle and liver glycogen stores can offer around 2,500 kcal of energy, the energy reservoir within muscle fibers and fat cells can substantially outweigh this, providing a staggering 70,000 to 75,000 kcal, even in lean adults. Among the chemical compounds categorized as fats, it is primarily triglycerides that function as significant energy stores. These triglycerides are stored in fat cells and are interspersed within and between skeletal muscle fibers. However, before these triglycerides can be utilized for energy production, they must undergo a process known as lipolysis, facilitated by enzymes called lipases.
The Vital Role of Free Fatty Acids (FFAs): In the realm of fat metabolism, free fatty acids (FFAs) play a central role as the primary energy source. Once liberated from glycerol, FFAs can enter the bloodstream, effectively traveling throughout the body. Their entry into muscle fibers can occur through simple diffusion or facilitated diffusion mediated by transporters. The rate of FFA entry hinges upon the concentration gradient, with higher concentrations of FFAs in the bloodstream increasing their rate of transport into muscle fibers.
The Intricate Process of β-Oxidation: In the journey from storage to energy production, FFAs undergo a transformation, eventually becoming acetyl CoA within the mitochondria. This critical conversion process is termed β-oxidation. Acetyl CoA is the gateway for FFAs into the Krebs cycle, a pivotal stage for oxidative metabolism. β-oxidation entails a series of steps in which two-carbon acyl units are systematically cleaved from the carbon chain of FFAs. The number of steps required correlates with the length of the FFA’s carbon chain, typically ranging between 14 and 24 carbons. For instance, an FFA with a 16-carbon chain yields eight molecules of acetyl CoA through β-oxidation. These acyl units are then converted into acetyl CoA, a molecule that enters the Krebs cycle, ultimately leading to ATP production.
Enzymatic Activation and Pathway Similarities: Upon entering muscle fibers, FFAs must undergo enzymatic activation fueled by ATP energy to prepare them for breakdown within the mitochondria. Similar to glycolysis, β-oxidation mandates an input of two ATP molecules for activation. However, unlike glycolysis, β-oxidation does not directly produce ATP.
The Krebs Cycle and Electron Transport Chain: Following β-oxidation, fat metabolism closely parallels the oxidative metabolism of carbohydrates. Acetyl CoA, formed through β-oxidation, takes its place in the Krebs cycle. During this phase, hydrogen ions are produced, which are then conveyed to the electron transport chain, accompanying the hydrogen ions generated during β-oxidation. This combination of hydrogen ions from multiple sources proceeds through oxidative phosphorylation, resulting in the generation of ATP, H2O, and carbon dioxide (CO2). However, the complete combustion of an FFA molecule requires more oxygen due to the FFA’s higher carbon content compared to glucose.
Maximizing Energy Potential from Fats: The distinct advantage of FFAs, with their increased carbon content, lies in their ability to yield more acetyl CoA per unit of fat, which subsequently enters the Krebs cycle. Consequently, more electrons are transported to the electron transport chain. This higher carbon count in FFAs enables fat metabolism to produce considerably more energy compared to glucose metabolism. For example, in the case of palmitic acid, a common 16-carbon FFA, the oxidative process produces 129 ATP molecules from a single palmitic acid molecule. This is a notable contrast to the 32 ATPs generated from glucose or 33 from glycogen.
Oxidation of Protein: While carbohydrates and fats are the body’s preferred fuel substrates, proteins, specifically the amino acids constituting proteins, can serve as an energy source under certain conditions. Amino acids can be converted into glucose through gluconeogenesis or transformed into various intermediates of oxidative metabolism, such as pyruvate or acetyl CoA, to enter the energy production process.
Calculating Protein’s Energy Yield: It is important to note that protein metabolism differs from that of carbohydrates and fats due to the presence of nitrogen in amino acids. As amino acids are catabolized, some of the released nitrogen is used to form new amino acids, with the remaining nitrogen converted into urea and subsequently excreted, primarily in urine. This conversion to urea necessitates the use of ATP, resulting in an energy expenditure.
Protein Metabolism:
Introduction to Protein as an Energy Source: In the intricate web of metabolic pathways within the human body, protein stands as a unique player. While carbohydrates and fats typically dominate as energy sources, proteins can also be harnessed to meet energy demands under specific circumstances. Amino acids, the fundamental building blocks of proteins, are not merely structural components; they can be catabolized to produce energy. However, unlike carbohydrates and fats, protein metabolism carries certain complexities due to the presence of nitrogen within amino acids.
Calculating the Energy Yield from Protein: In the controlled environment of a laboratory, when protein is subjected to combustion, it yields an energy output of approximately 5.65 kcal per gram. This value, however, does not wholly translate to the energy yield observed within the living body. The distinction arises from the energy expenditure incurred during the conversion of nitrogen from amino acids into urea, a process necessary for the elimination of excess nitrogen.
Adjusting Energy Yield for Real-World Protein Metabolism: To precisely evaluate the rate of protein metabolism, it becomes imperative to quantify the amount of nitrogen being excreted from the body. This assessment entails the collection of urine over extended periods, typically spanning 12 to 24 hours. This meticulous process aims to capture the complete picture of nitrogen elimination, enabling a more accurate determination of protein metabolism’s energy contribution.
Limited Role of Protein Metabolism in Total Energy Expenditure: In the context of energy utilization, it’s worth noting that the healthy human body minimally relies on protein metabolism during both rest and exercise. Typically, protein’s contribution to total energy expenditure remains modest, accounting for only a fraction of the overall energy demands. This fraction typically falls within the range of 5% to 10% of total energy expended. Consequently, when estimating total energy expenditure, protein metabolism is often omitted or given limited consideration.
Intricacies of Protein Metabolism: While protein’s primary role within the body is not energy provision, its significance transcends mere caloric value. Proteins serve multifaceted functions, including enzymatic catalysis, structural support, and transportation of molecules within cells. Moreover, amino acids obtained from dietary protein sources are indispensable for the synthesis of new proteins within the body, supporting growth, repair, and maintenance processes.
Protein Balance and Health Considerations: Maintaining an optimal protein balance is essential for overall health and well-being. A delicate equilibrium exists between protein intake, utilization, and excretion. Insufficient protein consumption can hinder the body’s ability to meet its diverse protein-related needs. Conversely, excessive protein intake can strain renal function due to the increased burden of nitrogen elimination. Achieving an appropriate balance through a balanced diet is crucial for promoting health and sustaining the intricate dance of protein metabolism within the body.
Protein as a Macronutrient: Proteins, alongside carbohydrates and fats, constitute one of the three primary macronutrients essential for human nutrition. While carbohydrates and fats are primarily recognized for their energy-yielding capabilities, proteins stand as an indispensable source of amino acids, crucial for various physiological processes. These amino acids contribute to the synthesis of essential molecules, including enzymes, hormones, and antibodies, reinforcing protein’s vital role in sustaining life.
Synergistic Dance of Energy Systems in Exercise
Introduction to Energy System Interaction: Exercise is a dynamic interplay between the body’s energy systems, each contributing to varying degrees to meet the energy demands of the activity. The three primary energy systems – the ATP-PCr system, the anaerobic glycolytic system, and the oxidative system – do not operate in isolation. Instead, they collaborate harmoniously to fuel various forms of physical exertion, from brief sprints to enduring endurance feats. This intricate choreography ensures that energy production aligns with the specific requirements of the activity at hand.
Dynamic Energy Systems in Action: In the realm of exercise physiology, no activity exclusively relies on a single energy system. Instead, one system typically takes the lead while others make vital supplementary contributions. The extent to which each system is involved depends on factors such as exercise intensity and duration. For instance, in a lightning-fast 100-meter sprint lasting mere seconds, the ATP-PCr system stands at the forefront, rapidly providing the necessary energy. Nevertheless, both the anaerobic glycolytic and oxidative systems also make minor contributions. In stark contrast, a 10,000-meter (10,936 yards) run spanning 30 minutes engages primarily the oxidative system. Despite this, the ATP-PCr and anaerobic glycolytic systems still play supporting roles throughout the event.
Power vs. Capacity: Energy system contributions are often assessed in terms of power and capacity. The ATP-PCr system, characterized by swift ATP production but limited capacity, excels during short bursts of high-intensity exercise. On the other hand, fat oxidation, a hallmark of the oxidative system, may take more time to ramp up but offers virtually limitless energy production, making it ideal for prolonged activities.
Understanding Muscle Fiber Energy Systems: Muscle fibers themselves possess distinctive energy system characteristics, which influence their performance during various activities. These characteristics help explain why some individuals excel in short, explosive sports while others thrive in endurance pursuits. For instance, the oxidative capacity of muscle tissue, denoted as Q . O2, quantifies its maximum ability to utilize oxygen. Laboratories employ this metric to measure a small sample of muscle tissue’s oxygen consumption under stimulated conditions.
Role of Enzyme Activity: Enzymes play a pivotal role in oxidative metabolism, facilitating the conversion of substrates into energy. Succinate dehydrogenase and citrate synthase, mitochondrial enzymes intricately involved in the Krebs cycle, are commonly measured indicators of a muscle fiber’s oxidative potential. Elevated enzyme activity signifies a greater capacity for aerobic exercise. Endurance athletes typically exhibit two to four times higher oxidative enzyme activities in their muscles compared to untrained individuals.
Fiber Type Composition and Training Influence: A muscle’s oxidative capacity is profoundly influenced by its fiber type composition. Slow-twitch (Type I) fibers inherently possess more mitochondria and oxidative enzymes, rendering them better suited for sustained aerobic activities. Conversely, fast-twitch (Type II) fibers excel in glycolytic energy production. Endurance training can augment oxidative capacity even in Type II fibers by stimulating mitochondrial growth and enhancing oxidative enzyme concentrations. Nonetheless, Type I fibers maintain their superior endurance capacity, even with similar training regimes.
Oxygen’s Vital Role: While mitochondrial density and oxidative enzyme activity are pivotal for oxidative metabolism, the ultimate driver is the availability of oxygen. At rest, oxygen demand is minimal, necessitating only modest respiratory and circulatory efforts. However, as exercise intensity escalates, energy requirements surge, demanding increased oxygen delivery. In response, respiration deepens, heart rate accelerates, and arterioles dilate to optimize oxygen-rich blood flow to active muscles.
Quantifying Oxygen Consumption: The body’s limited oxygen stores emphasize the critical role of continuous oxygen supply. Oxygen consumption at the lungs serves as an accurate indicator of aerobic energy production. Monitoring the volume of oxygen consumed provides valuable insights into the body’s metabolic response during exercise, reflecting the dynamic interaction between its energy systems.
In essence, exercise is a captivating symphony where energy systems harmonize to support a diverse range of physical activities. Understanding the intricate dynamics of these systems and their interplay sheds light on how the human body excels across a spectrum of athletic endeavors.
Energy Expenditure at Rest and During Exercise
Measuring energy expenditure in various conditions is vital for exercise physiologists. This section focuses on metabolic rates, including basal and resting metabolic rates, and how energy is expended at rest and during different exercise intensities and recovery periods.
Basal and Resting Metabolic Rates
Metabolic rate represents the rate at which the body consumes energy. Typically, whole-body oxygen consumption (V . O2) measurements are used to estimate energy expenditure. At rest, an average person consumes around 0.3 liters of O2 per minute, equivalent to 18 liters per hour or 432 liters per day.
To calculate an individual’s caloric expenditure, one can consider the respiratory exchange ratio (RER). An RER of approximately 0.80 is common for most resting individuals on a mixed diet. Using the caloric equivalent of 4.80 kcal per liter of O2 consumed, the caloric expenditure can be calculated as follows:
kcal/day = Liters of O2 consumed per day × kcal used per liter of O2 = 432 L O2/day × 4.80 kcal/L O2 = 2,074 kcal/day.
This value closely matches the expected resting energy expenditure for a 70 kg (154 lb) man. However, it doesn’t account for additional energy needs for daily activities or exercise.
The basal metabolic rate (BMR) is a standardized measure of energy expenditure at rest. BMR represents the energy expenditure rate for an individual at rest in a thermoneutral environment, after at least 8 hours of sleep and 12 hours of fasting. It reflects the minimum energy required for essential physiological functions.
BMR is directly related to an individual’s fat-free mass, usually reported in kilocalories per kilogram of fat-free mass per minute (kcal · kg FFM–1 · min–1). More fat-free mass results in a higher daily caloric expenditure. Women typically have lower BMR values than men of similar weight due to their lower fat-free mass and higher fat mass. Body surface area also affects BMR, with higher surface area leading to increased heat loss and, consequently, a higher BMR.
Numerous factors influence BMR, including age (which decreases BMR), body temperature (higher temperature increases BMR), psychological stress (which elevates BMR via the sympathetic nervous system), and hormones like thyroxine and epinephrine (which can increase BMR).
In practice, most researchers use resting metabolic rate (RMR) because it closely resembles BMR without the strict conditions. BMR and RMR values are typically within 5% to 10% of each other, ranging from 1,200 to 2,400 kcal/day. However, an individual’s total daily metabolic rate, considering normal daily activities, can range from 1,800 to 3,000 kcal/day.
Metabolic Rate During Submaximal Exercise
When engaging in exercise, the body’s energy requirements increase significantly compared to resting metabolic rates (RMR). Metabolism responds directly to exercise intensity. To illustrate this, consider an individual on a cycle ergometer:
- At 50 watts (W), when the person started cycling, their oxygen consumption (V . O2) increased rapidly within about 1 minute, reaching a steady-state value.
- Then, the same individual cycled at 100 W, and again, a steady-state V . O2 was reached within 1 to 2 minutes.
- This pattern continued as the subject cycled at 150 W, 200 W, 250 W, and 300 W, with steady-state V . O2 values achieved at each power output.
This clear progression of steady-state V . O2 values can be plotted against their respective power outputs, showing a linear increase in V . O2 with rising power output.
However, it’s important to note that at higher work rates, the V . O2 response does not follow the same steady-state pattern. Instead, it resembles a different graph. At power outputs above the lactate threshold (indicated by the dashed line), oxygen consumption continues to rise beyond the typical 1 to 2 minutes needed to reach a steady state. This phenomenon is known as the “slow component” of oxygen uptake kinetics.
The most probable explanation for this slow component is a change in muscle fiber recruitment patterns. More type II muscle fibers, which are less efficient and require higher oxygen consumption to produce the same power output, are recruited.
Additionally, there’s another phenomenon called “V . O2 drift.” This refers to a gradual increase in oxygen consumption during prolonged, submaximal, constant power output exercises. Unlike the slow component, V . O2 drift occurs at power outputs well below the lactate threshold, and the increase in V . O2 is much smaller. It is believed to be influenced by increased ventilation and the effects of elevated circulating catecholamines.
Maximal Capacity for Aerobic Exercise
It becomes evident that at a cycling intensity of 300 watts (W), the subject’s oxygen consumption (V . O2) response did not differ significantly from that observed at 250 W. This suggests that the individual had reached the maximum limit of their ability to increase V . O2, which is termed aerobic capacity, maximal oxygen uptake, or V . O2max. V . O2max is widely recognized as the most comprehensive measure of cardiorespiratory endurance or aerobic fitness.
In some exercise scenarios, a subject reaches the point of volitional fatigue before a plateau in the V . O2 response occurs, which is the criterion for a true V . O2max. In such cases, the highest oxygen uptake achieved is more accurately termed the peak oxygen uptake or V . O2peak. For instance, a highly trained marathon runner often achieves a higher V . O2 value (V . O2max) on a treadmill compared to testing to volitional fatigue on a cycle ergometer (V . O2peak) because muscle fatigue in the quadriceps may limit their ability to reach true maximal oxygen uptake.
While a high V . O2max is necessary for elite endurance athletes, it does not guarantee victory in endurance events like marathons. Similarly, performance in an endurance running test is only moderately predictive of an individual’s V . O2max. Thus, achieving an outstanding endurance performance requires more than just a high V . O2max.
It’s worth noting that V . O2max increases with physical training for about 8 to 12 weeks and then plateaus, even with continued high-intensity training. Despite this plateau, individuals can improve their endurance performance because they become more capable of performing at a higher percentage of their V . O2max. For example, most trained marathon runners can maintain a race pace that corresponds to about 75% to 80% of their V . O2max.
V . O2max is typically expressed relative to body weight, as milliliters of oxygen consumed per kilogram of body weight per minute (ml · kg–1 · min–1). This allows for more accurate comparisons of cardiorespiratory endurance capacity among individuals of different sizes in weight-bearing activities like running. In non-weight-bearing activities such as swimming and cycling, V . O2max is more appropriately measured in liters per minute.
For reference, normally active but untrained college students aged 18 to 22 typically have average V . O2max values of about 38 to 42 ml · kg–1 · min–1 for women and 44 to 50 ml · kg–1 · min–1 for men. After the age of 25 to 30, V . O2max tends to decrease by about 1% per year in inactive individuals due to a combination of biological aging and a sedentary lifestyle. Additionally, adult women generally have lower V . O2max values compared to adult men, partly due to differences in body composition (women typically have less fat-free mass and more fat mass) and lower blood hemoglobin content, resulting in a lower oxygen-carrying capacity.
Anaerobic Effort and Exercise Capacity
Exercise isn’t purely aerobic or anaerobic; both processes interact during physical activity. To evaluate this interaction, there are common methods for estimating anaerobic effort, including examining the excess postexercise oxygen consumption (EPOC) and identifying the lactate threshold.
Postexercise Oxygen Consumption (EPOC)
When exercise begins, the oxygen transport system, comprising respiration and circulation, doesn’t immediately provide the required amount of oxygen to active muscles. Oxygen consumption takes several minutes to reach a steady state where aerobic processes function fully, even though the body’s oxygen needs increase as soon as exercise starts.
As a result of this mismatch between oxygen requirements and oxygen delivery during the transition from rest to exercise, the body accumulates an oxygen deficit. This oxygen deficit occurs even at low exercise intensities and is calculated as the difference between the oxygen required for a given exercise intensity (at steady state) and the actual oxygen consumption.
Although active muscle activity stops at the beginning of recovery, oxygen consumption doesn’t immediately return to resting levels. Instead, oxygen consumption remains temporarily elevated. This post-exercise phenomenon is known as excess postexercise oxygen consumption (EPOC). EPOC represents the volume of oxygen consumed in the minutes immediately after exercise ends, exceeding what is typically consumed at rest.
Most people have experienced EPOC after intense exercise, characterized by a rapid pulse and heavy breathing. These physiological responses help support EPOC. After several minutes of recovery, heart rate and breathing rates return to resting levels.
Traditionally, the EPOC curve was described as having two components: an initial fast component and a secondary slow component. According to classical theory, the fast component reflected the oxygen needed to rebuild ATP and phosphocreatine (PCr) used during the early stages of exercise. Due to insufficient available oxygen, high-energy phosphate bonds in these compounds were broken to provide energy. During recovery, these bonds had to be re-formed through oxidative processes to replenish energy stores.
The slow component was thought to result from the removal of accumulated lactate from the tissues, either by conversion to glycogen or oxidation to carbon dioxide (CO2) and water (H2O), providing energy to restore glycogen stores.
However, recent research suggests that this classical explanation of EPOC is too simplistic. During the initial exercise phase, some oxygen is borrowed from oxygen stores (hemoglobin and myoglobin), which must be replenished during early recovery. Additionally, elevated respiration post-exercise aims to clear accumulated CO2 in the tissues as a metabolic by-product. Increased body temperature keeps metabolic and respiratory rates high, requiring more oxygen, and elevated norepinephrine and epinephrine concentrations during exercise have similar effects. Consequently, EPOC depends on various factors beyond just rebuilding ATP and PCr or clearing lactate produced by anaerobic metabolism.
Lactate Threshold
The lactate threshold serves as a valuable indicator of an athlete’s potential for endurance exercise. It is defined as the point at which blood lactate levels begin to significantly accumulate above resting concentrations during progressively intense exercise. To determine the lactate threshold, athletes may undergo testing involving incremental exercise on a treadmill or similar methods. Blood samples are taken at intervals to measure lactate levels.
The relationship between blood lactate concentration and exercise intensity can be plotted. At lower exercise intensities, blood lactate levels remain near or at resting values. However, as exercise intensity increases, blood lactate concentrations begin to rise disproportionately above resting levels, indicating the lactate threshold.
The lactate threshold signifies the interaction between aerobic and anaerobic energy systems. Some researchers have suggested that it signifies a shift towards anaerobic glycolysis, which produces lactate from pyruvic acid. Hence, the sudden increase in blood lactate during higher-intensity exercise is also referred to as the “anaerobic threshold.” It’s crucial to understand that blood lactate concentration is influenced not only by lactate production in muscles but also by lactate clearance or removal by various tissues, including the liver, skeletal muscle, and the heart.
Typically, the lactate threshold is expressed as a percentage of maximal oxygen uptake (% V . O2max) at which it occurs. The ability to exercise at higher intensities without excessive lactate accumulation is advantageous for athletes as lactate buildup contributes to fatigue. This threshold is closely related to an athlete’s endurance performance. The percentage of V . O2max that an athlete can sustain for an extended duration is associated with the lactate threshold. Therefore, a higher lactate threshold suggests greater aerobic exercise tolerance.
Economy of Effort
Athletes become more economical with practice, meaning they expend less energy to perform at a given pace. Runner A and Runner B, with similar V . O2max values showed differences in oxygen consumption at various running speeds. Runner B used significantly less oxygen than Runner A at speeds above 11.3 km/h. Runner B’s improved running economy provided a competitive advantage during marathon races, allowing him to beat Runner A by a considerable margin.
Economy of effort is influenced by a combination of physiological and biomechanical factors, but there is no single, specific explanation for the differences. Marathon runners are generally more economical, using 5% to 10% less energy at a given pace compared to middle-distance or sprint runners. However, the economy of effort is context-dependent, and runners may excel in different events based on their running economy. Factors such as running form and the specificity of training play roles in running economy differences.
In sports like swimming, economy of movement is even more critical, as energy is expended not only on propulsion but also on maintaining body position and overcoming water resistance. Efficient application of force against water is the primary determinant of swimming economy.
The energy expenditure for different activities varies depending on their intensity and type. Researchers have determined average energy costs for various activities, usually by measuring oxygen consumption during the activity to calculate an average oxygen uptake per unit of time. From this, the energy expenditure per minute (kcal/min) can be calculated.
It’s important to note that these values typically do not account for the anaerobic aspects of exercise and the excess post-exercise oxygen consumption (EPOC). Some activities may have an additional energy cost during the recovery period after exercise.
At rest, the body requires approximately 0.16 to 0.35 liters of oxygen per minute to meet its energy needs, which translates to roughly 0.80 to 1.75 kcal/min, 48 to 105 kcal/hour, or 1,152 to 2,520 kcal/day. Any physical activity above resting levels adds to this daily energy expenditure. The total daily caloric expenditure varies widely and depends on factors such as activity level, age, sex, size, weight, and body composition.
The energy costs of different sports and activities also differ. Some activities like archery or bowling require only slightly more energy than resting, while others like sprinting demand a very high rate of energy delivery but can only be sustained for a short duration. The duration of the activity also plays a significant role in total energy expenditure. For example, running at 25 km/h expends more energy per minute than jogging at 11 km/h, but the latter can be maintained for a longer period, resulting in a greater total energy expenditure for the exercise session.
Fatigue during exercise is a multifaceted phenomenon with varying characteristics depending on the nature and duration of the physical activity. While the term “fatigue” is commonly used, its meaning can differ substantially between short, high-intensity efforts like sprinting and prolonged, endurance-based activities such as marathon running. Generally, fatigue refers to the decline in muscular performance along with a sense of tiredness.
One way to define fatigue is as the inability to sustain the required power output to continue a specific level of muscular work at a given intensity. It’s important to note that fatigue is usually reversible through rest, distinguishing it from muscle weakness or damage.
A common misconception among exercisers is attributing fatigue to “lactic acid.” However, this oversimplification doesn’t capture the complexity of fatigue, and there is growing evidence suggesting that lactic acid may have performance-enhancing effects rather than being a primary cause of fatigue.
Fatigue is a highly intricate phenomenon with multiple underlying causes and factors. Researchers have predominantly explored several key factors contributing to fatigue during exercise:
- Decreased Rate of Energy Delivery: This pertains to the rate at which the body can supply energy substrates, such as ATP (adenosine triphosphate), to muscles during exercise. The three primary energy systems involved are ATP-PCr, anaerobic glycolysis, and oxidative metabolism.
- Accumulation of Metabolic By-Products: During intense exercise, metabolic by-products like lactate and hydrogen ions (H+) can accumulate within muscle tissues. These by-products can contribute to fatigue, especially in high-intensity, anaerobic efforts.
- Failure of the Muscle Fiber’s Contractile Mechanism: Fatigue can also result from the muscle fibers’ inability to sustain force production. This can occur due to factors such as the depletion of energy substrates or disruptions in calcium handling within muscle cells.
- Alterations in Neural Control: Changes in the neural control of muscle contraction can lead to fatigue. This may involve a decreased ability to activate motor units or a reduction in motor neuron firing rates.
The first three causes are often referred to as peripheral fatigue because they occur within the muscle itself. Additionally, alterations in the brain or central nervous system can also contribute to fatigue, known as central fatigue. It’s crucial to recognize that fatigue rarely results from a single factor but typically arises due to the interplay of multiple factors acting at various sites within the body.
The mechanisms of fatigue can vary depending on factors such as the type and intensity of exercise, the specific muscles involved, the individual’s training status, and even their dietary choices. While there has been significant research into fatigue, many questions remain unanswered, especially concerning the cellular sites of fatigue within muscle fibers.
Fatigue during exercise is a complex phenomenon influenced by factors like energy system utilization, the presence of metabolic by-products, contractile mechanisms, neural control, and more. Understanding these factors and their interactions is crucial for optimizing athletic performance and managing fatigue during exercise.
The role of energy availability, particularly in providing ATP (adenosine triphosphate) from substrates, is crucial in understanding fatigue during exercise from a physiological perspective.
PCr Depletion: PCr (phosphocreatine) is a crucial energy source, especially in short-term, high-intensity efforts. It is used to rapidly regenerate ATP in anaerobic conditions, allowing muscles to maintain ATP stores during intense activity. Studies involving muscle biopsies have shown that fatigue often coincides with the depletion of PCr. While ATP is directly responsible for energy during such activities, it is consumed less rapidly than PCr because ATP is produced through other systems as well. However, as PCr is depleted, the ability to replenish spent ATP is hindered, leading to a decrease in ATP concentration. In some cases of intense short-term exercise, the increase in inorganic phosphate (Pi), a breakdown product of PCr, may contribute to fatigue. To delay fatigue, athletes must control their effort rate through proper pacing to ensure that ATP and PCr are not depleted prematurely, even in endurance-type events.
Glycogen Depletion: Muscle glycogen serves as the primary energy source for ATP synthesis during activities lasting more than a few seconds. Unfortunately, glycogen reserves are limited and are depleted relatively quickly, especially with increasing exercise intensity. Studies have established a correlation between muscle glycogen depletion and fatigue during prolonged exercise. The rate of muscle glycogen depletion depends on the activity’s intensity, with higher intensity efforts resulting in a disproportionate decrease in muscle glycogen. During endurance exercise, glycogen depletion is a limiting factor for sustained performance. Muscle glycogen is used most rapidly during the initial stages of exercise. Athletes may experience a sensation of fatigue when their muscle glycogen levels become critically low, often referred to as “hitting the wall” in activities like marathon running. Additionally, muscle fibers are recruited in specific patterns and can become depleted of glycogen, reducing their ability to produce force.
Glycogen Depletion and Blood Glucose: While muscle glycogen contributes significantly to endurance exercise, it cannot provide enough carbohydrate for activities lasting several hours. Blood glucose plays a vital role in providing energy during prolonged exercise. The liver breaks down its stored glycogen to maintain blood glucose levels. In the early stages of exercise, muscle glucose uptake is relatively low, but as exercise duration increases, muscles increasingly rely on blood glucose. The liver must break down more glycogen to keep up with muscle glucose uptake. However, liver glycogen stores are limited, and when muscle uptake exceeds the liver’s glucose output, blood glucose concentration can decrease. As a result, muscles rely more on their glycogen reserves, accelerating glycogen depletion and leading to earlier exhaustion. However, most studies have shown no significant effect of carbohydrate ingestion on net muscle glycogen utilization during prolonged strenuous exercise.
Mechanisms of Fatigue with Glycogen Depletion: Glycogen depletion itself does not directly cause fatigue during endurance exercise. Instead, it may be the first step in a series of events leading to fatigue. A certain level of muscle glycogen metabolism is necessary to maintain oxidative metabolism of both carbohydrates and fats, using the Krebs cycle. Additionally, as glycogen is depleted, the reliance on the metabolism of fatty acids (FFAs) increases. This requires the transport of more FFAs into the mitochondria, and the rate of transfer may limit FFA oxidation, potentially reaching a point where it cannot keep up with the demand for fat oxidation. Thus, glycogen depletion may initiate a cascade of events contributing to fatigue during prolonged endurance exercise.
Metabolic By-Products and Fatigue:
Several metabolic by-products have been implicated in causing or contributing to fatigue during exercise. These include inorganic phosphate (Pi), heat, lactate, and hydrogen ions.
Heat, Muscle Temperature, and Fatigue:
Exercise leads to heat production, some of which is retained in the body, causing an increase in core temperature. Exercising in a hot environment can accelerate carbohydrate utilization and glycogen depletion. This effect may be stimulated by increased epinephrine secretion. High muscle temperatures are believed to impair both skeletal muscle function and muscle metabolism. Studies have shown that performance time to exhaustion can vary with ambient temperature, with optimal performance occurring at moderate temperatures. Precooling of muscles can extend exercise duration, while preheating can lead to earlier fatigue. Heat acclimation, which involves adapting to high temperatures, can help spare glycogen and reduce lactate accumulation during exercise.
Lactic Acid, Hydrogen Ions, and Fatigue:
Lactic acid is a by-product of anaerobic glycolysis, but it accumulates within muscle fibers primarily during short, intense muscular efforts. It is a common misconception that lactic acid is responsible for fatigue in all types of exercise. In reality, marathon runners can have near-baseline lactate concentrations at the end of a race, despite experiencing fatigue. Fatigue in such cases is more likely due to inadequate energy supply than excess lactic acid.
Short-duration, high-intensity activities like sprint running and sprint swimming can lead to significant accumulations of lactic acid. However, it’s important to note that lactic acid itself is not the cause of fatigue. Instead, when lactic acid is not cleared, it dissociates into lactate and hydrogen ions (H+), leading to muscle acidification, a condition known as acidosis.
The body possesses buffers like bicarbonate (HCO3) that help minimize the disruptive effects of hydrogen ions (H+). These buffers prevent a severe drop in pH, which would be lethal to cells. Even during intense exercise, the H+ concentration remains relatively low. However, pH changes can still negatively affect energy production and muscle contraction. An intracellular pH below 6.9 inhibits the action of an important glycolytic enzyme called phosphofructokinase, slowing down glycolysis and ATP production. At a pH of 6.4, H+ can halt glycogen breakdown, leading to a rapid decrease in ATP and ultimately exhaustion. Additionally, H+ can displace calcium within the muscle fiber, interfering with muscle contraction.
Most researchers agree that low muscle pH (acidosis) is the primary limiter of performance and the main cause of fatigue during maximal, all-out exercise lasting more than 20 to 30 seconds. Reestablishing the preexercise muscle pH after such an effort can take approximately 30 to 35 minutes of recovery, even when normal pH is restored. It’s worth noting that athletes can continue to exercise at relatively high intensities even with a muscle pH below 7.0 and a blood lactate level significantly above resting values.
Neuromuscular Fatigue:
In addition to factors within the muscle itself, evidence suggests that under certain circumstances, fatigue can result from an inability to activate muscle fibers, a function controlled by the nervous system. The nerve impulse travels across the neuromuscular junction to activate the muscle fiber’s membrane, initiating muscle contraction through a process known as excitation-contraction coupling. Several neural mechanisms could disrupt this process and potentially contribute to fatigue, including both peripheral and central factors.
Neural Transmission:
Fatigue may occur at the neuromuscular junction, where the transmission of nerve impulses to the muscle fiber membrane is hindered. This failure could involve various processes:
- The release or synthesis of acetylcholine (ACh), the neurotransmitter that relays the nerve impulse from the motor nerve to the muscle membrane, might be reduced.
- The enzyme cholinesterase, responsible for breaking down ACh after relaying the impulse, might become hyperactive, preventing sufficient ACh concentration for initiating an action potential.
- Conversely, cholinesterase activity might become hypoactive (inhibited), allowing excessive ACh accumulation, inhibiting relaxation.
- The muscle fiber membrane could develop a higher threshold for stimulation by motor neurons.
- Some substance might compete with ACh for the receptors on the muscle membrane without activating the membrane.
- Potassium might leave the intracellular space of the contracting muscle, decreasing the membrane potential.
While many of these causes for neuromuscular block have been associated with neuromuscular diseases like myasthenia gravis, they might also contribute to some forms of neuromuscular fatigue. There’s also evidence to suggest that fatigue could be due to calcium retention within the sarcoplasmic reticulum, decreasing the calcium available for muscle contraction. However, these theories remain speculative.
Central Nervous System:
The central nervous system (CNS) may also play a role in fatigue. In most types of fatigue, the CNS is undoubtedly involved to some extent. When a person’s muscles seem nearly exhausted, verbal encouragement, shouting, music, or even direct electrical stimulation of the muscles can enhance muscle contraction. However, the exact mechanisms behind the CNS’s role in causing, sensing, and overriding fatigue are not fully understood.
The recruitment of muscles partly relies on conscious control, and the stress of exhaustive exercise may lead to conscious or subconscious inhibition of an athlete’s willingness to endure further discomfort. The CNS might slow down exercise intensity to a tolerable level to protect the athlete. Researchers generally agree that the perception of discomfort associated with fatigue often occurs before a physiological limitation within the muscles. Most individuals, unless highly motivated, terminate exercise before their muscles reach physiological exhaustion. Athletes often train to develop proper pacing and tolerance for fatigue to achieve peak performance.